When velocity is not constant in time, we say that acceleration is taking place. The quantitative definition of acceleration is
Acceleration = (final velocity – initial velocity)/ (elapsed time)
Acceleration has a direction as well as a size, just like velocity.
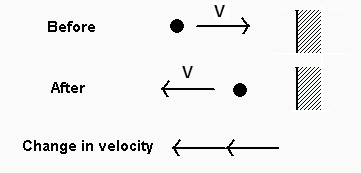
Here are some examples:

We have a lot of experience with acceleration. A falling object is an interesting special case, because the acceleration is constant. Unfortunately, the acceleration of a falling object is too large for us to be able to study it with meter sticks and stopwatches, In 1 second a ball will fall 5 m (16 feet), which won't fit in a classroom. Any ball-dropping experiment you can do in the classroom would be over in less than a second, which will be difficult to time accurately with a stopwatch (for example, a ball will fall 1 meter (3 feet) in 0.45 second). However, a ball rolling on a slightly inclined track accelerates much more slowly.
The activity we did timing the ball rolling down the incline did not directly measure the acceleration, because all we know is the average speed. The final speed is greater than the average speed, since the initial speed was less. The correct definition of acceleration (with the ball starting from rest) is to divide the final speed by the time on the ramp; dividing the average speed by the time on the ramp gives an "acceleration" that is too small by a factor of 2. However, the experiment does show that the average velocity increases in proportion to the time on the ramp, which implies that the acceleration is constant.
Graphical Representation of Accelerated Motion
 The velocity of a falling object increases the longer it falls, and this
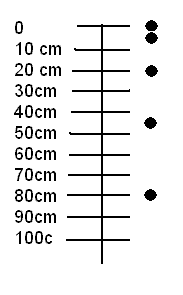
determines how far it goes in the next time interval. The picture shows the
position of a dropped ball at 0.1 sec, 0.2 sec, 0.3 sec, ... .
The ball positions cluster together at the beginning, but then get farther
apart, because the ball is going faster and faster downward.

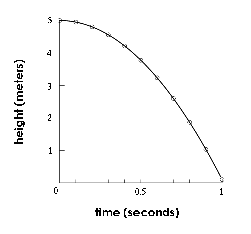
Another way to show the same information is to make a graph of
the position of the ball as a function of time.
This graph describes a ball that is dropped from a height of 5 meters.
After one second it is almost at the ground. In each successive
tenth of a second it moves farther, so the slope is steeper.
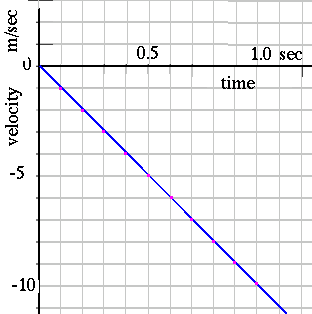
If we measure position in the upward direction (as in this graph),
the downward velocity could be represented by negative values.
 The graph of velocity as a function of time is a straight line
for this case.