Making line graphs
A line graph is a useful way to represent a relationship between variables. The most familiar kind of line graph uses time as the independent variable (the horizontal axis), to represent the prices in the stock market or the daily school attendance or how the temperature varies from day to day. However, a graph can be used to represent any pair of variables, provided that choosing a value for one determines the value for the other.
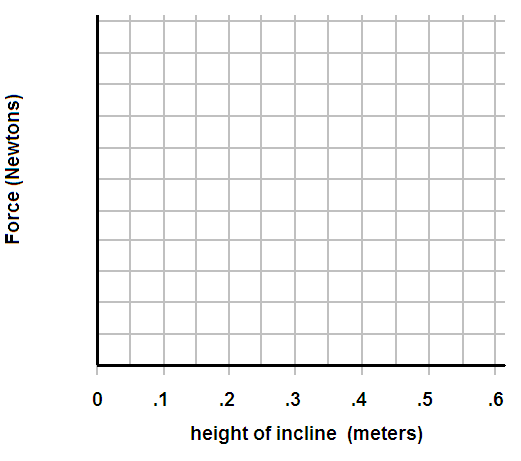
In the present case, each data point represents two numbers: the height of the upper end of the board, and the force needed to hold the cart on the incline. It doesn't really matter which goes on the horizontal and which on the vertical axis, but the convention is to put the variable that we choose (the height, in this case) on the horizontal axis, and the effect (the resulting force) on the vertical axis.
After placing these on the graph, a curve or line is drawn. In the present case, a straight line does very well. If we had chosen to measure the slope in a different way, we might have needed a curved line instead. The line does not have to go through the points, especially if it is believable that repeating the measurement would give slightly different results; but it should not miss the points by too much either, especially if the measurements are believed to be accurate.
The line represents what we think the experiment as a whole is trying to say, rather than connecting the dots. In drawing this line we are predicting the result of an infinite number of experiments, for all the possible slopes of the incline. We also note that extending the line beyond the set of data points can be dangerous: in the present case, by extending the line we will find a prediction for the force needed to hold the cart in place when one end of the board is a meter higher than the other (which is impossible, if the board is only a half meter long ).
Here are some more general pages about graphing:
Printable copy of the graph for this activity
Still more about graphing
Explaining Excel
Making graphs using Excel
(this page is in Excel)
10x10 graph paper
15x15 graph paper
20x20 graph paper