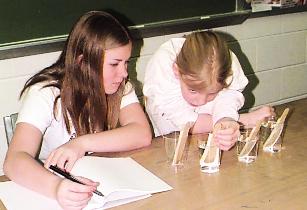
Materials: thermometers*, plastic cups*, a clock.
Place thermometers in four plastic cups. Leave one cup dry; add 60 milliters
(2 ounces = 4 tablespoons) of tap water to one; add 60 milliliters of hot water
to one; and add 60 milliliters of very cold water to one.
(Please note how "hot water" and "cold water" are defined).
Measure the temperature of each cup right after you fill them, and
then
every few minutes for 15 minutes, entering
your measurements into a table.
(It is a good idea to stir the container briefly
with the thermometer before you make each measurement.)
 Make a line graph showing how the temperature of each cup changed
during the observation period, with the time as the independent
variable (measured along the horizontal axis) and with the temperature
as the dependent variable (along the vertical axis).
Put all four graphs on the same grid, to make it easy to compare them.
Make a line graph showing how the temperature of each cup changed
during the observation period, with the time as the independent
variable (measured along the horizontal axis) and with the temperature
as the dependent variable (along the vertical axis).
Put all four graphs on the same grid, to make it easy to compare them.
At the end of the activity, write a commentary on what you learned:
Check the box when you are done:
Science content: thermal equilibrium