and the Amount of Water in the Air
A wet towel in contact with dry air tries to come into equilibrium in two ways: it shares energy (which should make the temperature the same), but it also shares the water, which makes the temperatures different (because turning liquid water on the towel into water vapor in the air requires energy, and this is removed from the towel).
| The Relationship Between Temperature
and the Amount of Water in the Air |
|---|
|
|
There is a limit to the amount of water air can hold. This graph shows how the maximum percentage of water in air depends on the temperature.
The black line is the saturation condition: it is the maximum amount of water that air can hold at a given temperature. For example, air at 20oC can hold no more than 2.3% water (the other 97.7% is nitrogen and oxygen, with a little bit of other stuff); air at 30oC can hold up to 4.2% water, but no more. The black line indicates where the air is saturated. Air above this line cannot absorb any more water, and thus will not have an evaporative cooling effect. This corresponds to "100% relative humidity". This is why high humidity is so uncomfortable: we lose the cooling effect of evaporation, an important way to regulate body temperature.
The colored region below the line represents air that
could absorb more water, which is generally the case. A
damp object in this air will be cooled to a certain extent,
because water is able to evaporate from it.
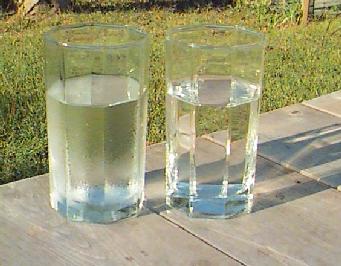
The Dew Point
Here is something we can learn from this graph:.
why the outside of a glass sometimes gets beaded with moisture.
Imagine a summer day when the temperature is 30oC
(= 86oF), and the air contains 2% water, corresponding
to point A on the graph. The air could hold over 4% water, so this
is not a particularly humid day, nor a particularly dry one, either.
Now suppose you have a cool drink (10 oC = 40 oF).
The air that comes in
contact with the drink cools down, following the line from "A" to "B". The water percentage in the air is still 2% as it cools.
But before the air reaches the 10 o C of the glass, it reaches the saturation point, "B".
For the air to cool more, water must condense out of it --
and appears on the outside of the glass.
The horizontal line at 2% is the amount of water in the
air; it encounters the saturation line at point "B",
at the temperature 18 oC. This is called the
"dew point" for air containing this much water.
Any object that is colder than this will become covered
with condensation.
The dew point temperature depends on the amount of water in the air.
You determined the dew point for your work area in the
first activity; you can use the graph to find out how
much water was in the air.
Relative Humidity
As water evaporates, a wet towel becomes cooler. The limit to this process is set by the dew point -- the towel will stop evaporating and start condensing water if it gets colder than the dew point. This is the basis for a way to determine how much water is in the air. Suppose we wrap a small wet cloth about the end of a thermometer and wave it about to evaporate as much water as possible. The temperature recorded by the wet thermometer is the dew point, and is the coolest the wet cloth can get by evaporation in this air. Suppose the thermometer reads 18 o C -- then we are at point "B", and according to the graph, this means there is 2% water in the air. Now measure the actual air temperature with a dry thermometer, and let's assume the result is 30 o C. Drawing a horizontal line from point "B" to 30 oC puts us at point "A".
At 30 o C, the air can actually hold 4.2% water (read straight up from 30 o C to the saturation curve, and then move left to the vertical axis to read the corresponding percentage of water allowed). But the water concentration is only 2%. The possible concentration is 4.2%. The ratio of these is the relative humidity, 2/4.2 = 48%.
Humidity is important to us --