Target Chamber Voltage Scan
Table of Contents
Full list of plots for reference for target chamber voltage scan.
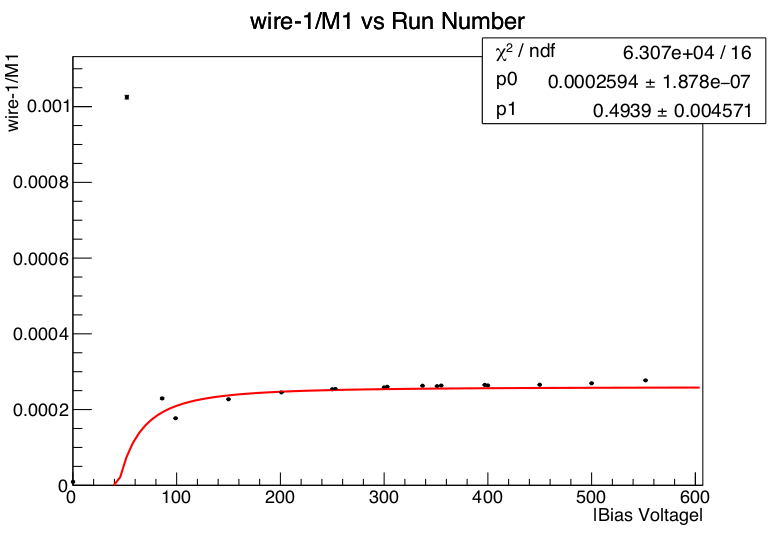
The voltage can analysis was done is a number of steps. The first step was to look at the low voltage recombination range. This range was complicated by some low voltage artifacts resulting from unknown causes. A possible cause is a capacitive coupling involving the HV supply causing a signal in the wires due to a resonance effect at some applied voltages. This is considered to probably not have an effect at the higher voltage range data was taken at as the range -250 to -400V was measured twice.
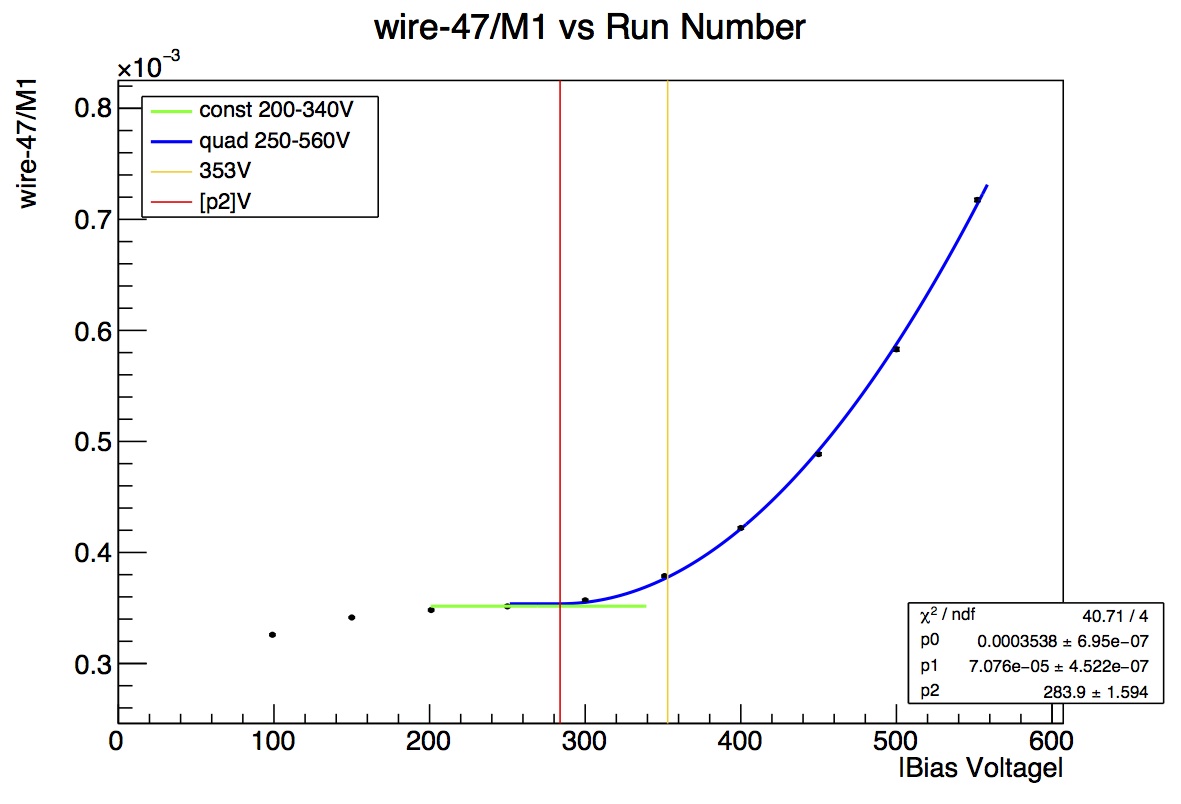
The second set of fitting was to look at the amplification range. On most wires the operating voltage during data taking of -353 volts was inside the amplification range. This was fit as a transition from a constant line to a qaudratic amplification region. This fit most of the amplification ranges fairly well.
Third fit method was to use a recombination to amplification fitting with no linear region between. This was found to be a better fit for all of the outer wires from 1-72 as their linear region was much smaller or nonexistent than for the inner wires or wires deeper into the chamber where the recombination region was not as visible. Wire 4, 5, 17, 26, 28 also had this fit applied. Wire 8 had a modified version that fit from 180 to 560 to ignore what looked like an inflated 150V point that other wires used.
Plots
All Voltage Scan Plots Fitting Recombination Range:
WireRatioPlots-VoltScan.rootWire Ratio Plot Fitting High Voltage Range - Linear to Quadratic
WireRatioPlots-Amplification.rootAmplification-All_over_M1.pdfWire Ration Plot Fitting High Voltage Range - Recombination to Quadratic
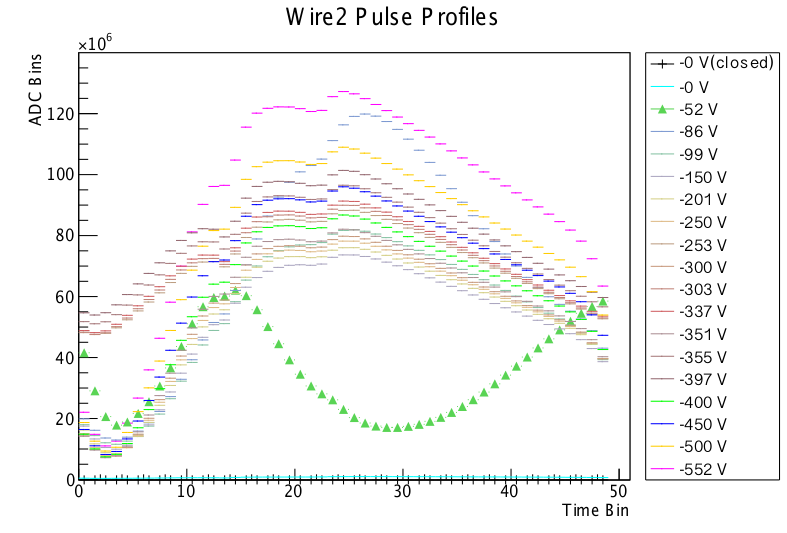
Amplification-All_over_M1 recomb to quad.pdfAll Overlaid Pulse Plots
Plotting-VoltScan-overlays.root
Plotting-VoltScan-overlays_dividebyM1_600.rootPlotting-VoltScan-overlays-continuous line all wires.pdf - all wires pulse profile plotted with continuous line instead of segments.
Note: When using TTreeRaw objects that are saved to a TFile with a TLegend the following error occurs:
Warning in <TBufferFile::WriteObjectAny>: since TTreeRaw has no public constructor
which can be called without argument, objects of this class
can not be read with the current library. You will need to
add a default constructor before attempting to read it.
and the legend does not bring the colors that were assigned to the plot. The overlay plots below in the pdfs do have the correct line colors in the legend.
Amplification Fitting Values
The FitParameters-n3HeTargetVoltagScan files use a combination of the linear to quadratic and the recombination to quadratic where the best choice was taken from visual inspection and the value of chi squared for the fit to have the line pass through as many of the data points as possible and to minimize the chi squared.As indicated above the outer wires in the first 8 planes were fit to the recombination to quadratic method, along with wires 4, 5, 8,17,26, and 28.
FitParameters-n3HeTargetVoltageScan.csv- wires 6 not included, fitting values, uncertainties and chi squared are here. It has constant, transition to recombination and rate of amplification for all wires merging the two fit methods but discarding some of the recombination fitting parameters from the outer wires.
Root TF1 formula for linear to amplification fitting
TF1 *fm3 = new TF1("fm3","(x<[2])*[0]+(x>[2])*([0]+([1]*(x-[2]))2)",200,560);
FitParameters-recombination.csv - has recombination values for wires 4, 5, 8,17,26, and 28 and outer wires 1-72. For use with equation
Root TF1 formula for recombination to amplification fitting
TF1 *fm4 = new TF1("fm3","(x<[2])*([0]-[1]/x2) + (x>[2])*([0]-[1]/[2]2 + ([3]*(x-[2]))2)",125,560);
To access the csv files in root the following method can be used:
ttree that will be used to load FittingParameters.csv
TTree *T = new TTree("FittingParameters","Fitting Parameters from Voltage Scan");
int nlines = T->ReadFile("FitParameters-n3HeTargetVoltageScan.csv",
"wirenum/I:p0/D:p0err/D:p1/D:p1err/D:p2/D:p2err/D:chisqrd/D:NDF/I");
number of lines loaded, should be 144 (one line per wire,first line commented out by # in csv file)
cout<<"found "<< nlines <<"points"<<endl;
variables to read from ttree
double vp0, vp0err, vp1, vp1err, vp2, vp2err, vchisqrd;
int vwirenum, vNDF;
cout<<"set variable to branch address"<<endl;
T->SetBranchAddress("p0",&vp0);
T->SetBranchAddress("p0err",&vp0err);
T->SetBranchAddress("p1",&vp1);
T->SetBranchAddress("p1err",&vp1err);
T->SetBranchAddress("p2",&vp2);
T->SetBranchAddress("p2err",&vp2err);
T->SetBranchAddress("chisqrd",&vchisqrd);
T->SetBranchAddress("wirenum",&vwirenum);
T->SetBranchAddress("NDF",&vNDF);
FitParameters-n3HeTargetVoltageScan.xlsx - updated fitting parameters for the newer better fits showed in the same plots as 2016/02/15 Monday Meeting presentation. No uncertainties or chi squared.
FitParameters-PresentationPlots.xlsx
- plots in 2016/02/15 Monday Meeting presentation made from this spread sheet. wires 129 and 142 added Kept around for comparison to the presentation


