The n-3He Experiment at SNS : Instrumental Asymmetry
Table of Contents
Table of Contents
Instrumental Asymmetry
During asymmetry analyses by L. Kabir it was found that there were large instrumental asymmetries during the summer beam off data taking. The source of these asymmetries has not been identified, and it is the goal of the the analyses detailed on this pages to find the cause of these asymmetries.This page is to be used by anyone doing analysis on the instrumental asymmetries to share information, coordinate analysis, and display analysis results.
Current headings and file uploads are a work in progress and should be modified by anyone wishing to contribute.
List of Asymmetry Facts
A list of known facts regarding the asymmetry has been compiled in the pdf below.n3He Instrumental Asymmetry Fact List 2017_07_24.pdf
Modifications or changes to the main list can be entered here and the list will be updated periodically.
Open Questions to be Answered
- What was used to trigger the DAQ during summer data taking?
- SNS has event 39, this is a pulse that is sent to the choppers which is coordinated with the kicker magnets for when protons are sent to the mercury target. During the summer the kicker magnetic would not be functioning. Would this pulse still be present, and is so would it still be a good 60Hz signal?
- It is also possible but not probable, that we used our own 60Hz pulse generator to trigger our DAQ, the logbook does not have records of this being done.
- How was the DAQ, spin flipper, and accelerator coordinated?
- Do we have wiring and triggering diagrams that can be found?
- Where are the DAQ wiring diagrams?
Values of Interest
Various values of interest to the overall instrumental asymmetry calculations.Run Ranges
Tables of the run ranges being investigated and text file list of the run ranges will be uploaded here.Beam Off Run List
List of all good beam off data files that are known to be good.runList-NoBeam.txt
Summer Run Data Range
List of all good runs taken during the summer running period.runList-NoBeam-summer2015_.txt
Tuesday Run Data Range
List of all good runs taken during Tuesday maintenance periods at the SNS. During each Tuesday from 9:00am to 4:00pm the acceleratorrunList-NoBeam-Tuesday_9-4PM.txt
Thank you to L. Kabir for providing the various beam off run lists.
Beam Sum Values
A set of beam on wire signal sum values were created by L. Kabir. These can be used to normalize the instrumental asymmetry for comparison to the beam on asymmetries. These values have been created by summing the measured voltage in each time bin from 5-44.AverageWireSignal.txt
Geometry Factors
Geometry factors were calculated for each cell in the target chamber that relate the position and shape of the beam and target. These geometry factors are required here for comparing the instrumental asymmetry size to the final physics asymmetry. See the Simulations page, with particle note to Kabir's presentation on 2017/13/01 has a table of geometry factors.Standard Asymmetry Data Selection
For the beam on Asymmetry calculation only some of the taken time bins were good stable beam able to be used for asymmetry calculations. To make an equivalent comparison to beam on data the same time bin range should be used for calculating the instrumental asymmetries.| Wires |
|||
|---|---|---|---|
| First Time Bin |
Last Time Bin |
||
| 5 |
44 |
Future Analysis Tasks
Analysis tasks that are underway, or would be useful- Detailed analysis of every time bin with no averaging for Summer and Tuesday Runs
- Tuesday Data Analysis
- Do the Tuesday runs taken during facility maintenance when the beam was off show the same effects as the summer runs?
- Fourier Analysis
- What frequency components are present in the noisy data that are not present in the good data?
- Are these frequencies still present in the beam on data?
Analysis Results
Weekly Meetings
Various weekly meetings results are the main repositories of instrumental asymmetry information at this time, and the weekly presentations on this topic will be stored on that section of the website.Weekly meeting from 4/21/2017 to present are primarily concerned with the instrumental asymmetries.
Results by M. McCrea
This section is under constructions at this time, plots will be added when prepared in a web friendly format.Below are a number of selected plots of interest from different stages of the instrumental asymmetry data analysis.
Method
For the base instrumental asymmetry it is calculated as the difference between the sum of the time bins for a given wire in a pulse as
where Y is the measured voltage, i is the wire number, j the run number, k the pulse number, and t the time bin.

where A is the asymmtry, and q is the asymmetry number.
Pulse and asymmetry numbers are indexed starting at zero. So the first pulse in a run is pulse 0, and is even numbered while the second pulse in a run is pulse 1, and is odd numbered.
For each run the average and standard error are calculated for the asmyemtry for every pulse pair in a beam off run.
For comparison of these instrumental asymmetries to the physics asymmetries they must be rescaled by the average wire yield for each wire, and the wires geometry factors as

where G_w is the geometry factor for wire w, and \bar(S)_w is the average wire yield over all beam on runs.
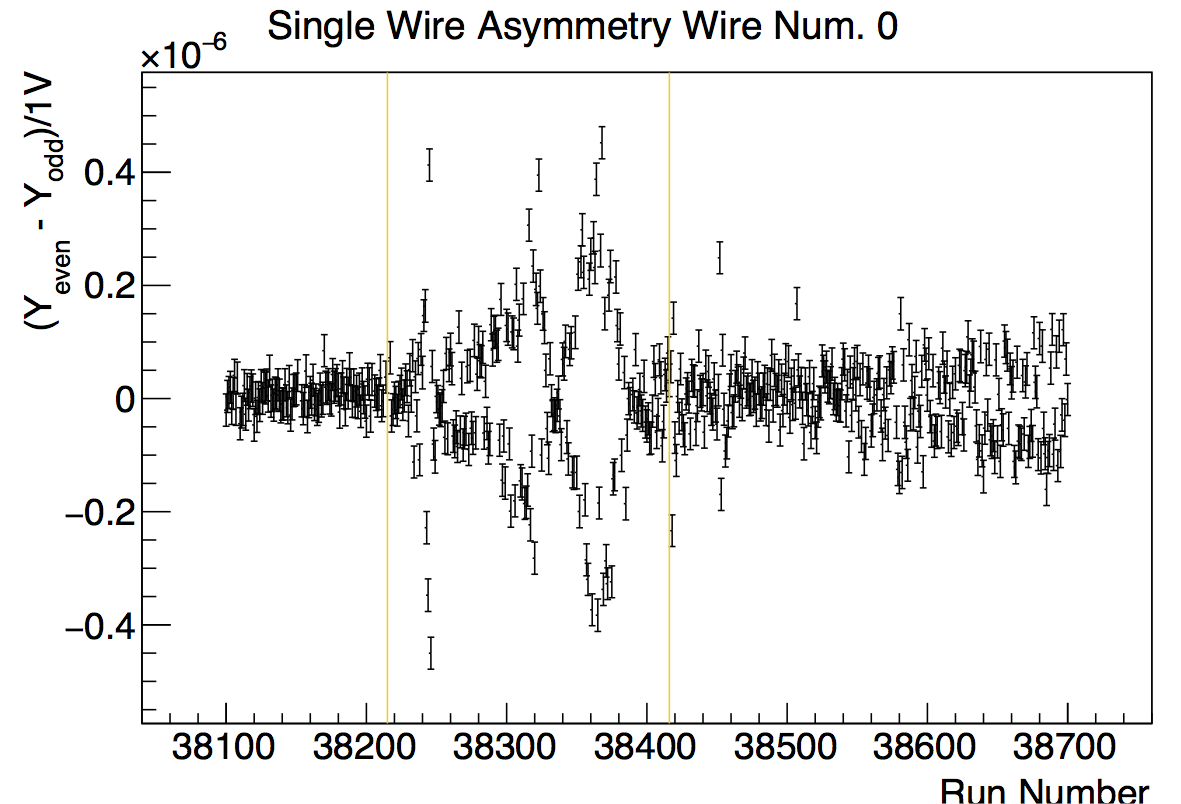
The initial instrumental asymmetry was demonstrated by Kabir using wire 0 over the summer running period. The following plot shows the asymmetry calculated without rescaling:
 |
| The wire 0 run average asymmetry calculated as the different in all time bins between even and odd numbered consecutive pulses. Error bars are standard error. |
Following this the analysis was expanded to to look at a larger range of wires in detail:
(panel plot to be added)
These analysis looked at the asymmetry over a large number of time bins. Looking at the run averaged asymmetry for each individual time bin showed a sinusoidal pattern during the noisy summer running that is mostly absent from other time periods.
(add individual and other plots here)
Looking at the run average wire yield directly shows that the sinusoidal pattern is also in the wire yield, but during the summer asymmetry runs the even and out pulses are out of phase or have different pulse shapes, while during the quiet running periods the even and odd pulses in phases and have the same shape.
In the process of trying to find the cause of these anomalies it was discovered that the state of the DAQ and other equipment was not well recorded during the summer running period, and some undocumented changes were made to the DAQ setup at an unknow time during the summer maintenance period. Due to this it was decided that the summer running period would not be used in the final analysis of the instrumental asymmetry.
The most useful period of running to be examined was during the Tuesday maintenance periods during which the run state is better recorded, and this will then provide an in situ measurement of the beam off asymetry located closer in time to the actual beam on physics asymmetry data taking.
| Run Avg. Inst. Asymmetry |
Time Bin Run Avg. Inst. Asym. |
Time Bin Average Wire Yield |
Wire Yield Individual Pulses |
|
|---|---|---|---|---|
| Tuesday 1 |
PlotTbins-PanelPlots-r17784.pdf PlotTbins-r17784.pdf |
WireYield-PlotTBins-PanelPlot-r17784.pdfWireYield-PlotTBins-overlay-r17784.pdf |
WireYield-PlotPulses-r17784-w0-p0-250.pdf WireYield-PlotTBins-overlay-r17784.pdf |
|
| Summer Quiet Running |
WireInstAsym-PanelPlot-SummerRuns.pdf Panel plot of Instrumental asymmetry for all summer periods. Zoomed to to view axis labels. |
PlotTbins-PanelPlots-r38100.pdf PlotTbins-r38100.pdf |
WireYield-PlotTBins-overlay-r38100.pdf |
WireYield-PlotPulses-r38100-w0-p0-250.pdf WireYield-PlotPulses-r38100-w2-p0-250.pdf |
| Summer Noisy Running |
PlotTbins-PanelPlots-r38314.pdf PlotTbins-r38314.pdf |
WireYield-PlotTBins-overlay-r38314.pdf |
WireYield-PlotPulses-r38314-w0-p0-250.pdf WireYield-PlotPulses-r38314-w2-p0-250.pdf |
|
| Comments |
For the panel plot pdfs: One page 1 the panel plots each have an individual Y-axis scale. On page 2 each panel plot has the same Y-axis scale as all other plots on the same page. Page 3 is plot generation information. The other document has all the plot on individual pages. |
For the millivolt pedestal signal there is significant variation in the signal at the 1e-5 range. For the summer quiet runs the variation is in phases for the odd and even pusles, but for the summer noisy runs the odd and even pulses are out of phase. |
Pulse to pulse signal variation is large on individual pulses. The wires pulses do not show a consistent pattern that is easily visible. |
FFT Analysis
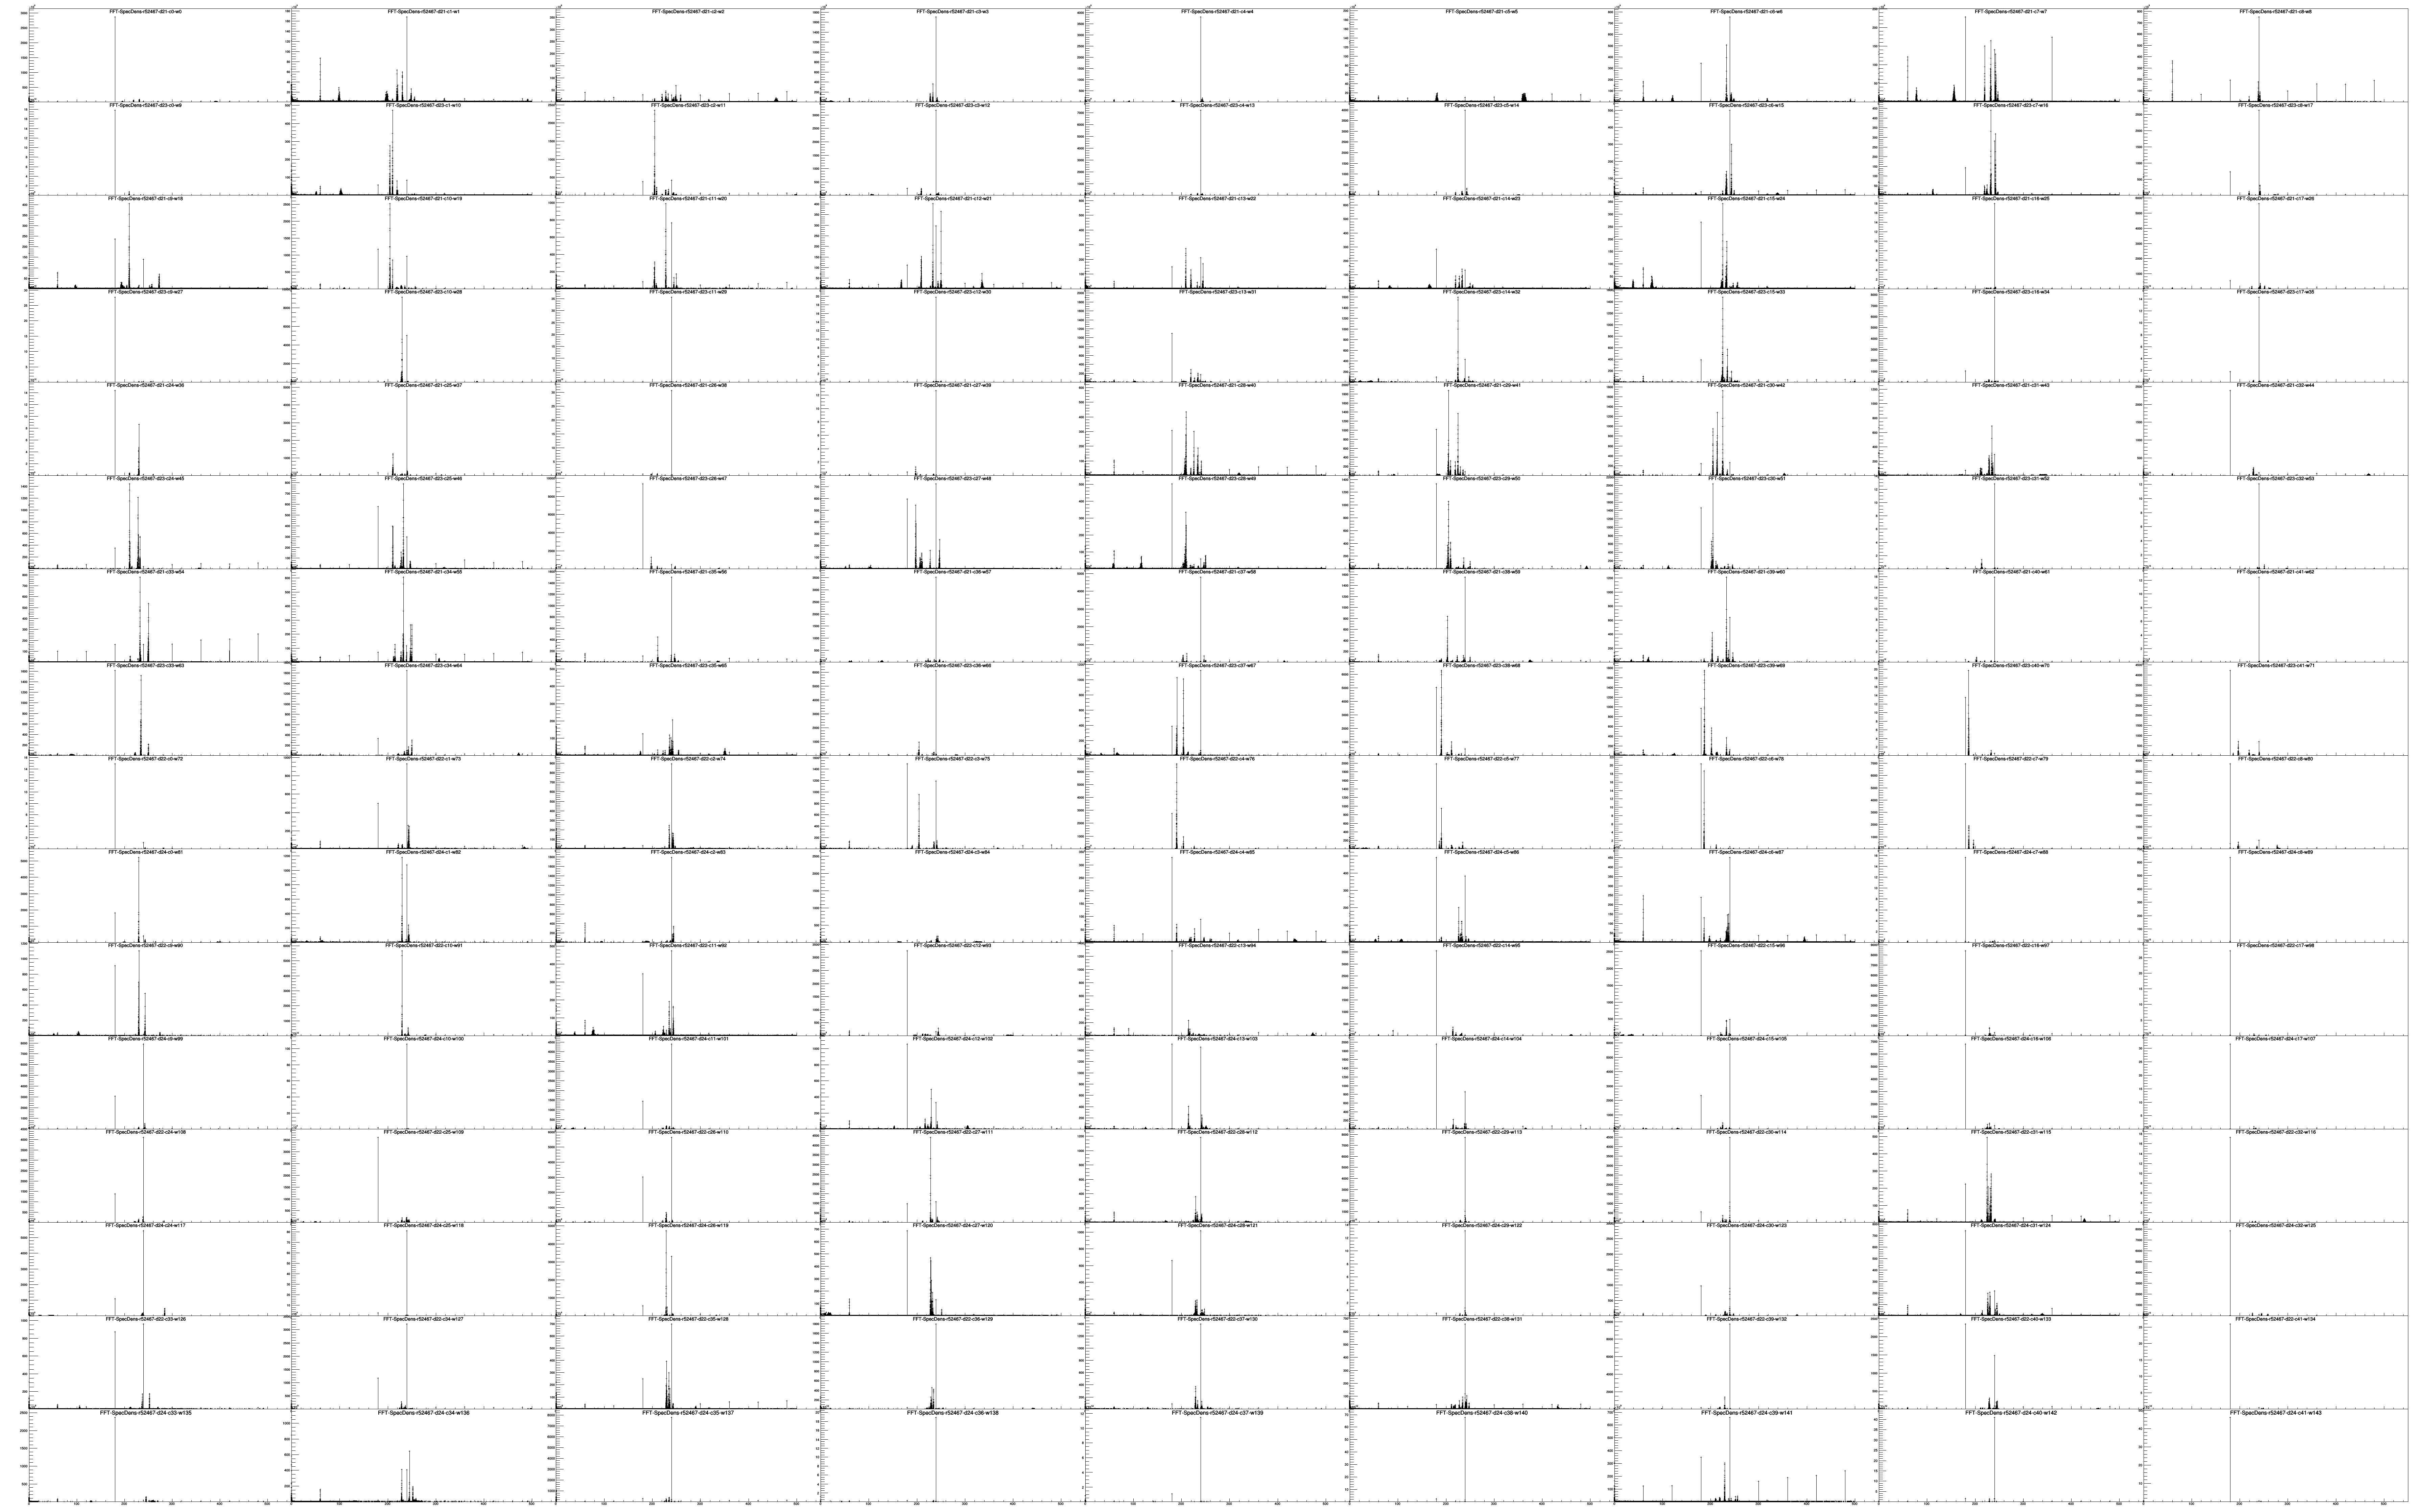
One part of the noise analysis was to examine the Fast Fourier Transform (FFT) of the wire signals over time. To perform the fast Fourier transformFFT Method
See the weekly meeting presentation from 02/03/2018.FFT Results
Below is a link to a Google Drive folder with the FFT results for selected runs. Plots are included of the data for each DAQ channel over the full frequency range, and from 0-500Hz for each clean DAQ Channel. There are additionally comma separated text files of the 0-500Hz data. If someone wishes the full data files that can be provided, but was not prepared by default due to the large file size.https://drive.google.com/drive/folders/1yYWWp1J3c4HHfl2dIMVfbRDUY_VLAaSk?usp=sharing
 |
| Example panel plot for the low frequency range data from run 52467. |